SEARCH THE BIG DROP
THE DAILY BIG DROP — FREE

The Worst News of the Day
(Or How Bad Is It?)
Who is taking land, who is paying for the power and what switches on next. Free, and you can leave whenever you like.
The Worst News of the Day
(Or How Bad Is It?)
Who is taking land, who is paying for the power and what switches on next. Free, and you can leave whenever you like.


The regulations, dockets, power fights and pipeline decisions shaping America's AI buildout — as they happen.
 FERC environmental review lets public scrutinize Texas Access Project
The environmental assessment gives the public and officials detailed information about the Texas Access Project's possible environmental effects before any final decision.Comments close Oct. 19 — 1 day left.
The document: “Environmental Assessments; Availability, etc.: Kinder Morgan Louisiana Pipeline LLC; Proposed Texas Access Project”

 DEADLINE RADAR
 1 DAY LEFT3 DAYS LEFT4 DAYS LEFT
Before a federal agency makes a rule final, it has to consider the comments people submitted during the public comment period. Once that deadline closes, the agency moves forward using the information already in the official record. If you did not submit your concern before the window closed, it may not be part of what the agency considers when finalizing the rule.
 An editorial tempo gauge — comment windows weighted by how soon they close, plus fresh filings, capped at 100
 JUST DROPPED
PHMSA now has additional information from Crimson Pipeline Company in this case, which it may use when considering what to do in the related matter.
This is a supplemental filing from Crimson Pipeline Company submitted to PHMSA for the ongoing matter identified in this docket.
It is not open for comment — it moves on the record as filed.
The parties it binds are named in the document itself — docket PHMSA-2026-2477 on the record.
No comment window is posted on this document.
 HOT DOCKETS
 TRENDING NOW
Filed for publication, not yet published — the earliest a federal document is public.
 POWER PLAYERS
 COMMENT EXPLOSIONS
 WATCHLIST ALERTS
Federal regulators who sign new rules.










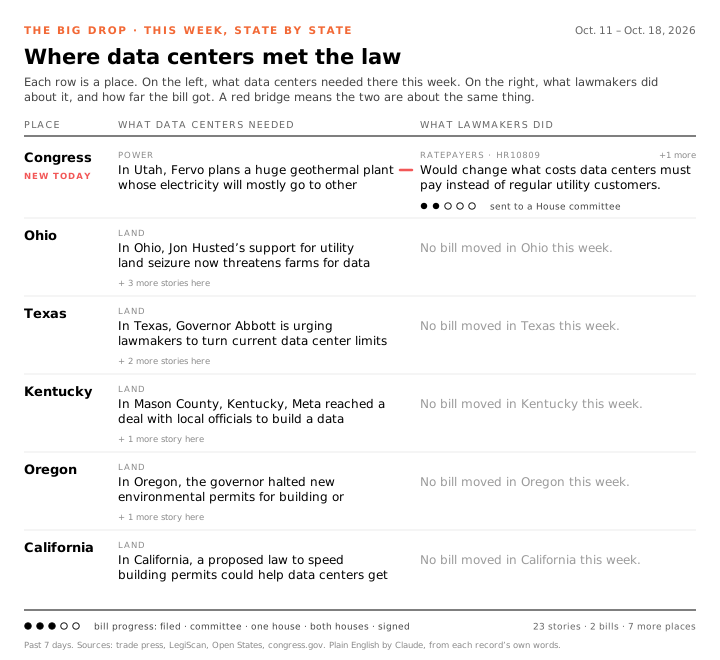
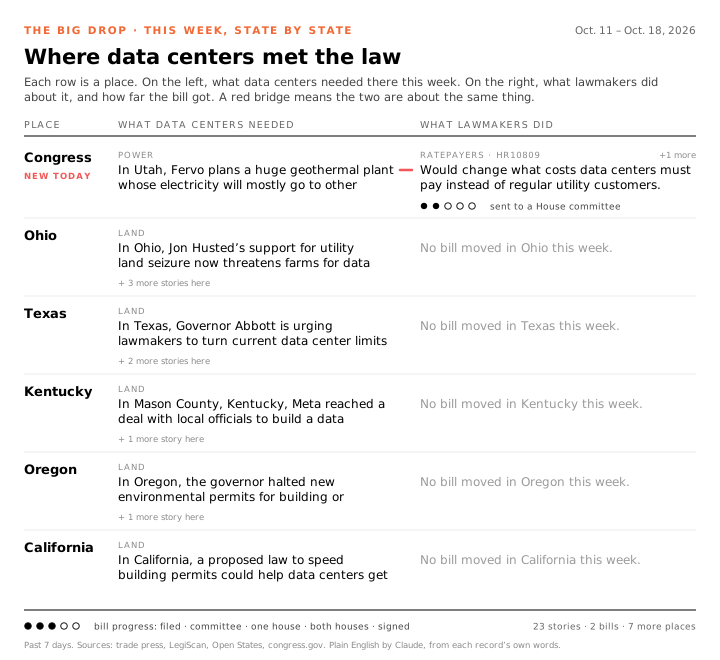
 WHERE DATA CENTERS MET THE LAW
Data centers need power, gas, water, land, tax breaks and a place on the grid. Every day The Big Drop matches the week’s data-center news, state by state, against the bills moving in that statehouse or in Congress, and says in plain words what each bill would do and how far it got. Hover a row for every story and bill behind it.
 THE EPICENTER OF THE AI BUILDOUT
Data refreshed — · Sources: Loudoun County land applications (LOLA); OpenStreetMap contributors, Open Database License (ODbL); Epoch AI, Creative Commons Attribution 4.0 (CC BY 4.0)
 STILL TIME TO OBJECT
The full packages — what happened, why it matters, and how to file — live at thebigdrop.us/still-time-to-object.
 The Federal Register
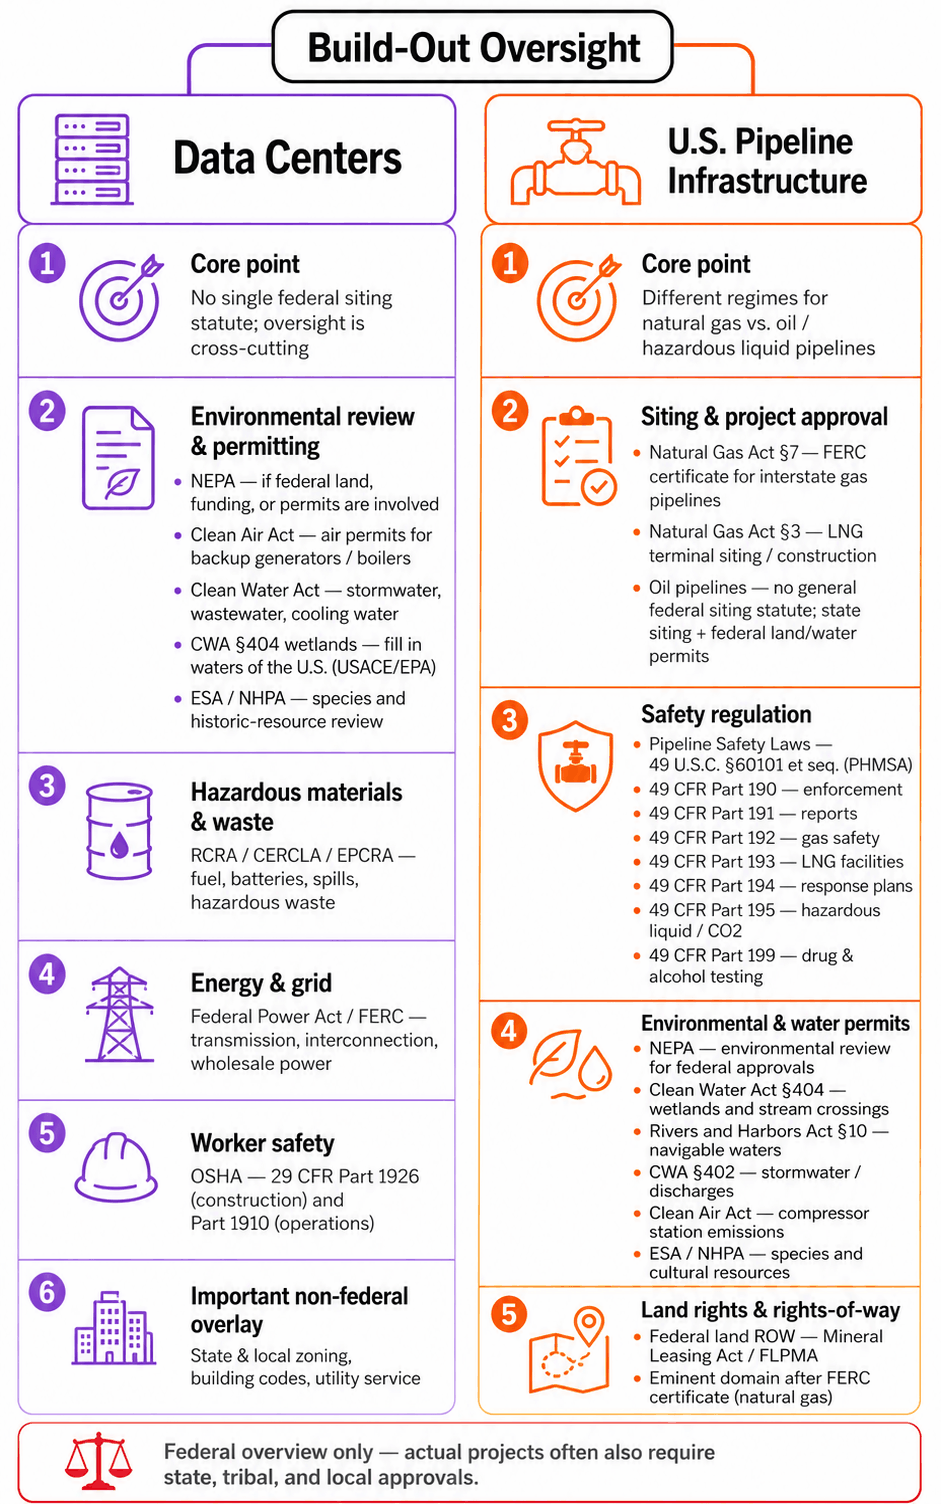
 FERC NEPA schedule · RuleTraceU.S. Energy Information Administration (EIA)U.S. Census Bureau · construction spending + County Business PatternsThe Big Drop’s Pipeline Infrastructure Daily map
How the grid number is made: the reading is EIA-930 hourly demand for the PJM Dominion zone (API facet subba=DOM, produced by daily_draw.py), summed for Oct. 14 — 410 GWh, an average draw of 17.1 GW. The raw single-day change against Oct. 15, 2025 (the same weekday a year earlier) was +26.8%, but one-day comparisons swing with weather, so the page reports the 30-day weekday-matched average instead: 377 GWh a day, +10.1% year over year (7-day: 372 GWh, +16.4%). The homes equivalence uses EIA’s average residential consumption, 10,791 kWh a year (2023). The zone covers most of Virginia and part of North Carolina; the Ashburn data-center cluster sits inside it. Data: the EIA API dataset · EIA Hourly Electric Grid Monitor, PJM.
Source: Regulations.gov, the federal docket system. The lead, Just Dropped, and Deadline Radar headlines are The Big Drop’s plain-English renderings of each document’s official title and government-published abstract; the official title appears beside them; every list headline is the document’s own title, and every link lands on the government record. The heat index is The Big Drop’s own tempo gauge computed from the counts on this page. Humans and machines can both make mistakes — verify before acting.
Good choice…
I’ll be in touch as soon as I can.